| expressions_bingo.ppt |

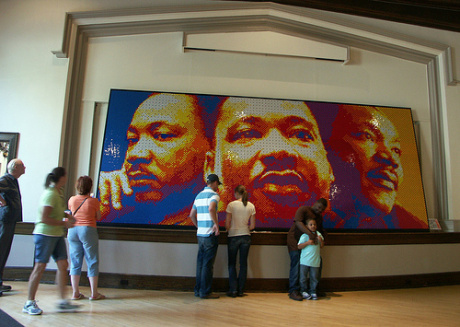
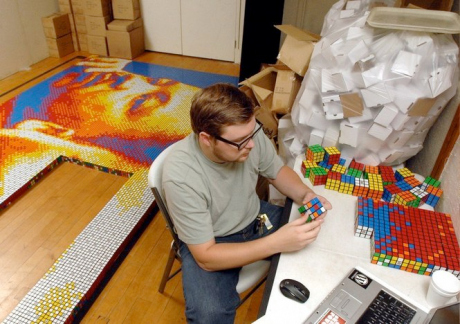
I have used a picture from google images here but when I use this in lessons I take a photo of the class first (in height order - tallest on the right - the lesson before if I can) and use that. The pupils find it really easy then to relate the concepts and key words to themselves and they get a real understanding of what lower quartile/ upper quartile and interquatile range means before we even start looking at any data. The Presidents task comes from Don Stewards Blog (Median) which is a fantastic bank of resources if you don't already use it. The powerpoint is one I have picked up along the way - I don't know where it originates from.

A few stick on scabs and fake blood. A willing member of SLT and 'super 8' style video clips and year 7 have got to save the world. The original work (and more) can be found here http://motivate.maths.org/content/MathsHealth/
Simple but effective idea, easy to implement.
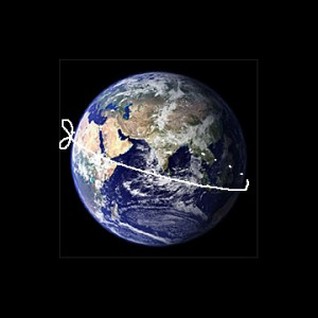 Lesson idea taken from The Math Book (Clifford A. Pickover). Imagine you are given a rope that tightly encircles the equator of a Basketball. How much longer would you have to make the rope so it is one foot from the surface of the basketball at all points? Next, imagine we have that rope around the equator of the Earth, which would make the rope about 25000 miles long! How much longer would you now have to make the rope so that it is one foot off the ground all around the equator? The surprising answer is 2Л for both the basketball and the Earth. This lesson uses this as a backdrop to discovering pi, systematic approaches to problem solving and algebraic proof with a little bit of stem and leaf and averages thrown in for good measure. It was originally written in Keynote so may have a couple of glitches with the powerpoint presentation.
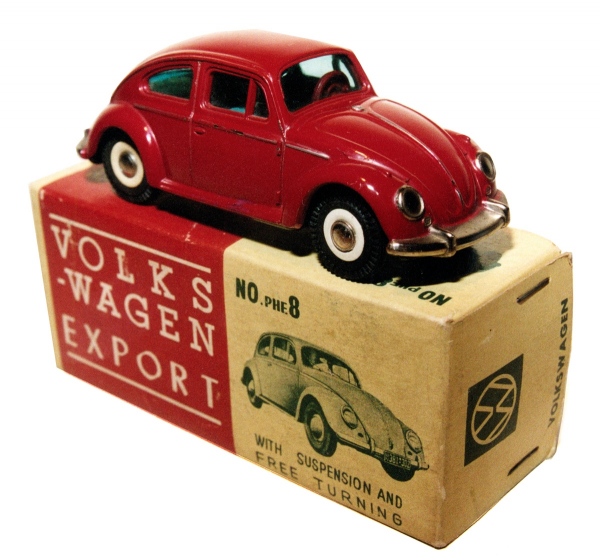
The levels I have put on this chart may be slightly out, I haven't had time to fully check them. The half term task has come from the Wiki as we try to move to the pupils directing the learning. For this lesson each table will have a toy car and be asked to make a box. There will be no help offered by me, we will have all the resources they need available. I will photograph work, put it on the Wiki and we will discuss strategies and work together to make nets (presuming they work this out). From there we will go on to how much card we have used and into surface area (this has been a topic raised on the wiki already). Pupils should have photo's ready for this lesson (from homework - find a photo that raises a question) which we will use to direct our learning this half term.
Using steps to scaffold learning. The step The reason why The hint Space for reflection This is a first draft at using this particular structure (including a reason and a hint). The lesson is an adaptation of Don Steward's work.
While researching for this I found this resource which is freely available on the TES website, I have included it here as I think it's structure is brilliant.
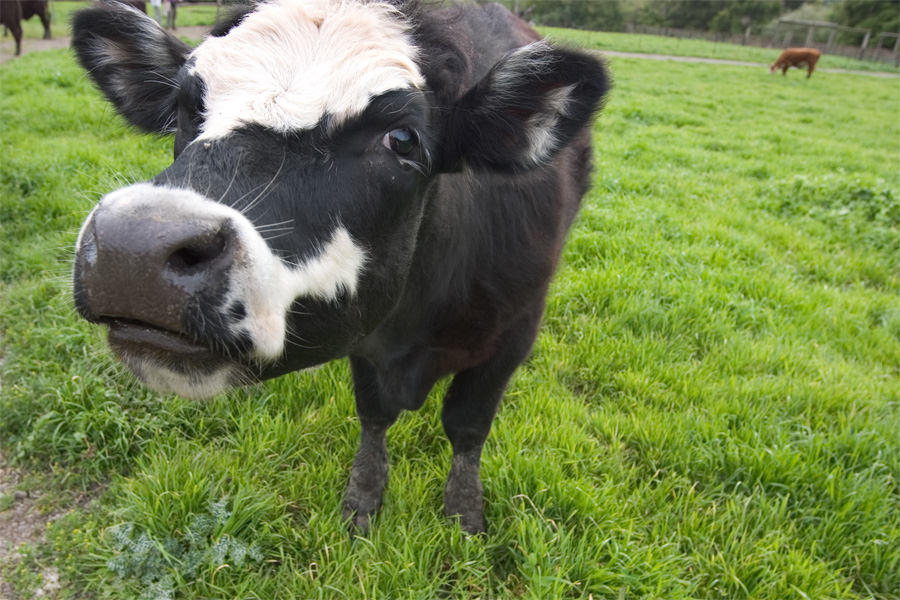
Dotty averages was an excellent lesson, pupils are really taking control of the learning, when they returned with their sorted data some had simply put it in order, others had done graphs and some had worked out averages. This meant they introduced the key words, we wrote them on the board then groups tried to work out what they meant - the class were given 5 minutes with the instruction 'if no-one on your table knows then go and find someone that does - you must know the answer in 5 minutes'. I told them nothing and they all could tell me the about the mean, median, mode and range - they ironed out their own misconceptions and corrected their own thinking. They then worked out the mean, median, mode and range of our data. I added in my guess of 2500 and we reworked our range and averages to see the effect - this led to us agreeing to use the median rather than the mean. To introduce stem and leaf we discussed the pro's and cons of their own tables, then I asked someone to read out the data and completed a stem and leaf on the board as the data was read out - pupils were then asked to explain how it worked, they could easily work this out from watching me complete it but they all followed much easier than when I have taken the time to explain what I am doing. We redid the dots experiment (by which point they were desperate for the answer), then we compared our answers using the range and median. Finally they were given the result - our second guess was closer and with a lower range. Pupils were able to demonstrate a good understanding of both terms (beyond it's the biggest take the smallest) 'How big is a cow' is to cement the work on stem and leaf and to get some levelled work in the books (peer assessed). To do 'how big is a cow' I show the class a normal cloth and ask them to write down how many cloths it would take to go from head to the back end of a cow. We record the data in a stem and leaf, discuss and then take 2 volunteers to be the head and bum and we measure out our cow. Every time I've done this the cow is usually too big to fit in the room. Boys V Girls on staring competition, record the data on a 2 way stem and leaf, compare boys results against girls, complete a written summary and peer assess.
| AuthorRichermaths - this is a collection of ideas/ lesson plans and an opportunity to refelct on my practice. ArchivesNovember 2014 CategoriesAll | ||||||||||||||||||||||||||||||||||
 RSS Feed